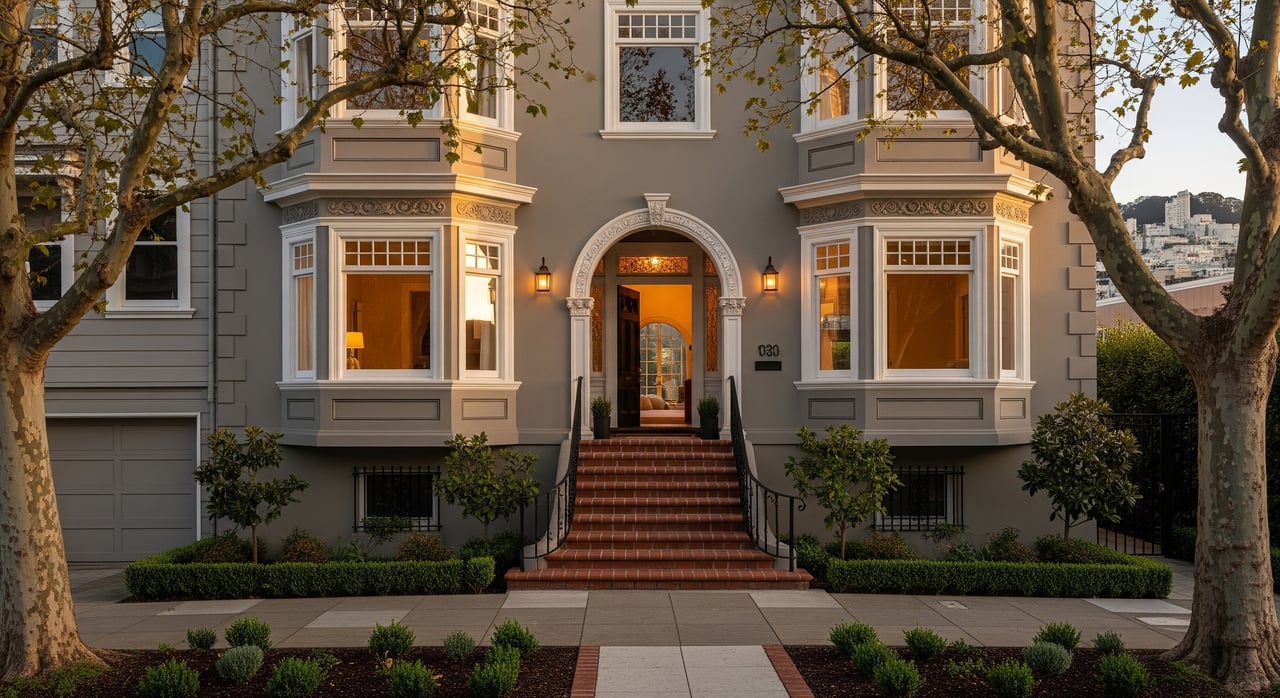
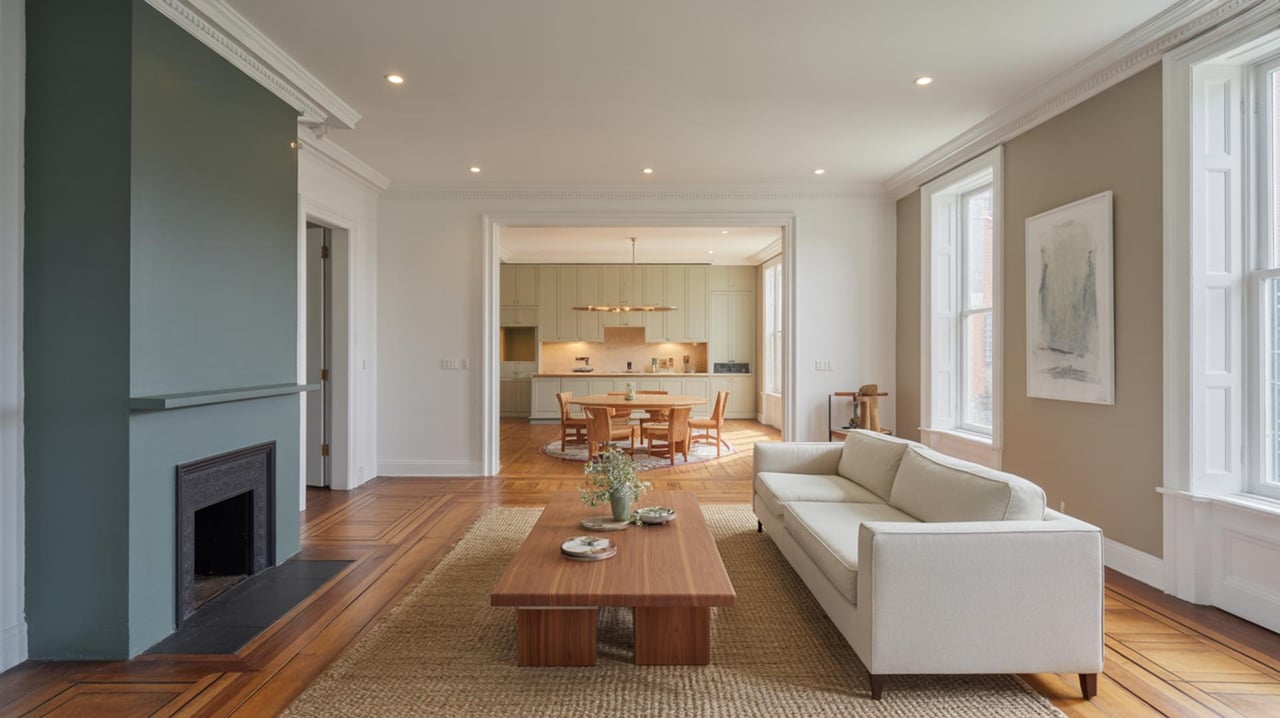
I recently pulled data for a neighbor who is evaluating selling his Burlingame home. It’s a bit of a mixed bag with trends but overall there is an improvement from October 2008.
Days on market is down slightly:

Median price is up:

Inventory is down:

Units sold has been on a consistent upward trend with the exception of August & October 2009.

There has been a steady up tic in buyer demand as of April of 2009 with properties going into contract at a 33% increase.

Then we hit the expireds. Wow!! A 129% increase in expireds. Expireds include withdrawn and canceled listings as well. I did a little more digging & pulled these properties in the MLS. Pricing was a good cross section of Burlingame properties ranging from ~$2,000,000 to the low of $779K for a bungalow on the east side.
Apparently there was a rather large group of sellers for the month of October who didn’t have realistic pricing in place, putting their overpriced property on market & letting it linger for up to 6 months before taking it off market.
Who whee!! We must have had a group of tired, frustrated agents who didn’t get paid at the end of the day (or more accurately at the end of 3–6 months).

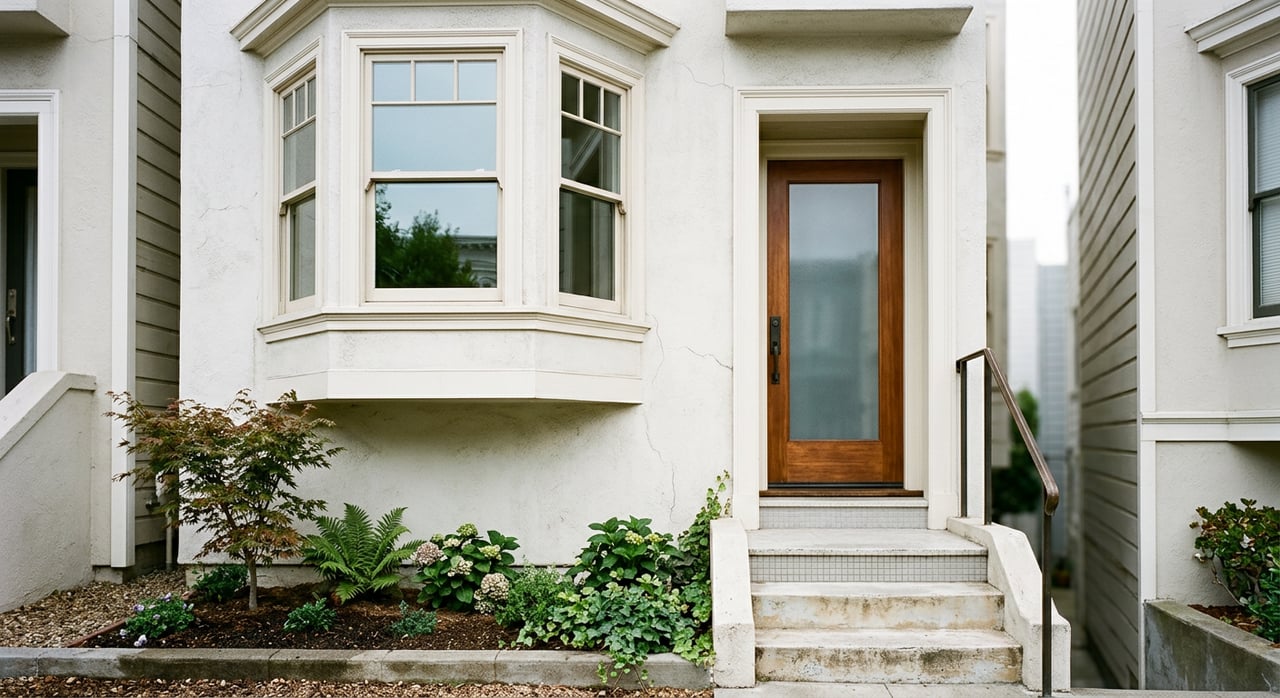
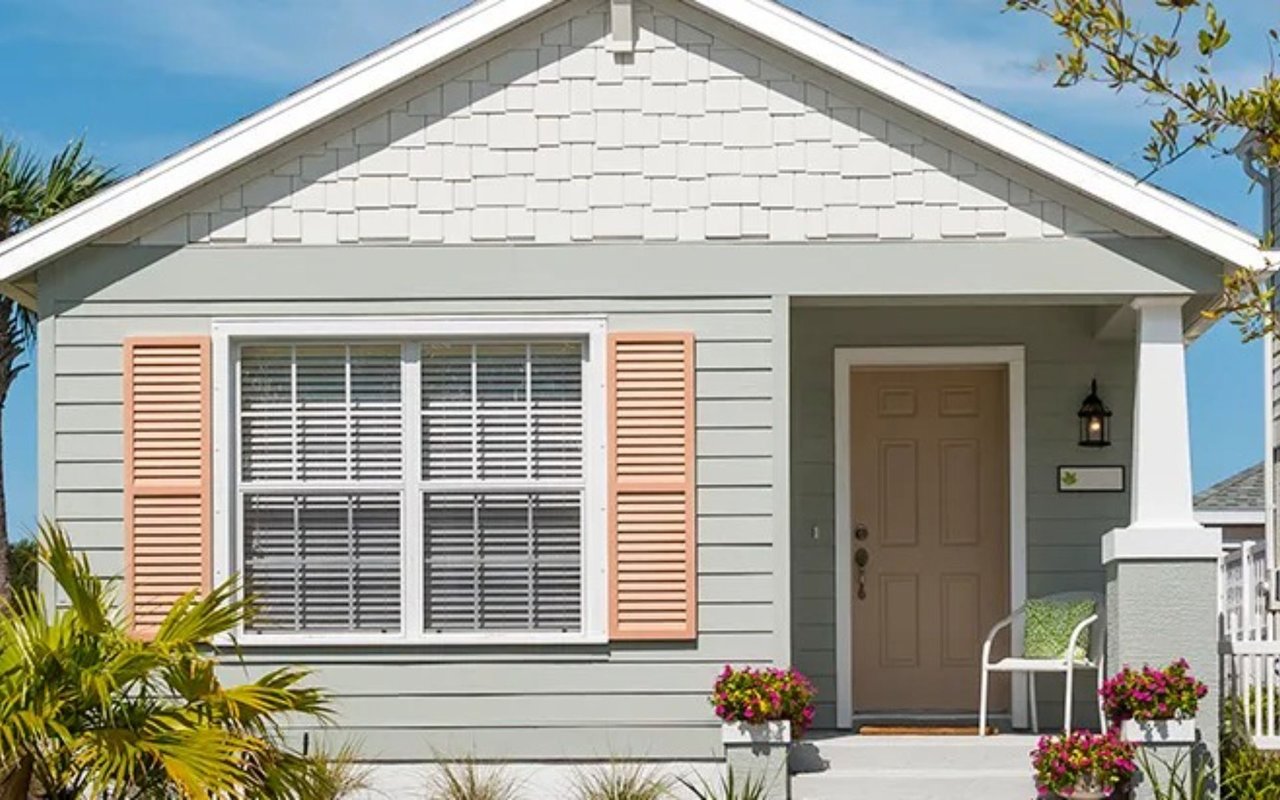
October had a sale high of $3,050,000 and a low of $525,000, which was a short sale in Lyon Hoag (east side) — a super cute 2br/1ba Craftsman Bungalow with no parking (it’s pretty rare to come across homes without parking in Burlingame unlike S.F.) and a small lot (3125sf vs. the average 5000sf). It so reminded me of a San Francisco property.
To wrap it up, Burlingame properties that are well priced & show well are selling within 30 days & sometimes within the first week with multiple offers.